Dashboard
The BCMS Manager’s default view is the dashboard, which provides a quick access view for any system issues (under System Status) and information of registered and active systems in the organization (under Clients). By default, the charts will update in real time so long as the ‘auto refresh’ option remains selected.
There are 3 main elements to the default Dashboard view: the navigation ribbon on the left side, the controls bar along the top, and the chart view in the middle. This image depicts an unlicensed and inactive BCMS installation:

A properly configured system would look more like:

Dashboard Navigation
Section titled “Dashboard Navigation”Users and administrators can navigate through the Manager via this navigation ribbon. Click on any line to change the Chart View to the desired view. The navigation ribbon can be collapsed or expanded by clicking on the ‘hamburger’ button in the control bar:

The following screenshots show the nagivation ribbon’s default view and collapsed view for Proton for each user type.
Administrator Power User *User*


Each of the options available in the navigation panel are reviewed in the sections below. BCMS Administrator accounts have access to view and modify three pages — Users, Privacy, and Diagnostics — which non-administrative users will not see.
For BCMS administration purposes the only account type required is the Administrator account. Power and Standard user accounts should only be used by customers with Proton enabled.
Controls Bar
Section titled “Controls Bar”The Controls Bar contains a variety of links and controls for BCMS Manager.

The ‘hamburger’ control ( ) will collapse or expand the left-most Navigation bar.
The server URL (https://BrowsiumDemo/Server in the screenshot above) shows which BCMS server the Manager is currently connected to.
The settings control ( ) provides access to advanced features including downloading the Browsium Client, changing the password for the user currently logged into the Manager, and logging out of the Manager. Use Log out to connect to a different Proton server.

User accounts and passwords are stored in the BCMS server (in the database), not in the Manager. The Manager application can be used to log into various BCMS servers, but only one at a time for each browser instance.
Starting with 4.9.1, BCMS supports Single Sign On (SSO) using either Okta or Azure AD identify provider solutions. More information on configuring SSO with BCMS can be found in section 2.4
If the ‘Auto-refresh’ button is enabled, then any data updates made by active Browsium clients will be automatically reflected in the current view.
The date picker control allows you to select a date range, in UTC time, to filter BCMS data in the current view. The date picker will automatically compute {Today} and {Yesterday} and replace them with month and day. Note that any given date in UTC time may be different than the date in your local time zone.
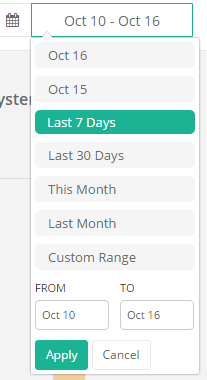
The following table provides the details on what you will see for each date picker selection.
Selection Description
{Today} Only data collected since 12:00 midnight UTC will be shown
{Yesterday} Only data collected between 12:00 midnight and 11:59pm UTC the day before will be shown
Last 7 Days All data collected in the previous 7 days (including today) will be shown. This is the default data filter for Proton
Last 30 Days All data collected in the previous 30 days (including today) will be shown
This Month Only data collected since the 1^st^ of the current month will be shown
Last Month Only data collected during the previous month will be shown
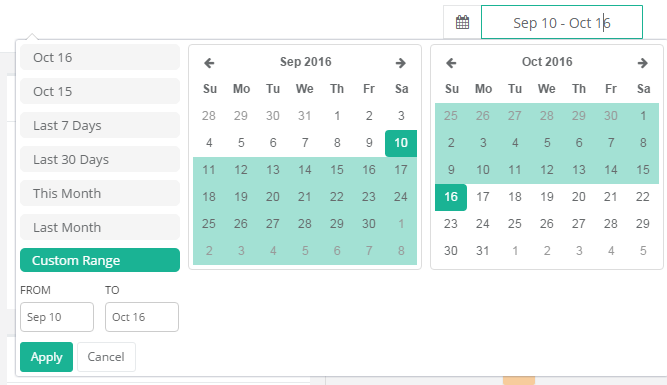
Custom Range Allows the administrator to designate custom start and end dates for the view
Section titled “Custom Range Allows the administrator to designate custom start and end dates for the view”Once a date range is selected, the Chart View will update automatically to display only data from the user’s selection.
Chart View
Section titled “Chart View”The Chart View area (main page body) displays the data currently selected by the navigation ribbon. This section is where all interaction is done with the BCMS settings (per the date range selected in the date picker).

Clicking on any graph, column or header item will navigate the user to the appropriate area to drill into further details.